Dashboard Execution Report: What Happened, and How Can We Improve?

Here's an analysis of a hypothetical Dashboard Execution Report, focusing on identifying the problems and suggesting improvements:
A Dashboard Execution Report, in its essence, is a retrospective analysis of a dashboard's performance over a specific period. It's not merely a compilation of metrics, but a critical examination of whether the dashboard achieved its intended purpose – informing decisions, driving action, and ultimately, improving business outcomes. A poorly executed dashboard, regardless of its aesthetic appeal, is a liability. It can lead to misinformed decisions, wasted resources, and missed opportunities. Therefore, a robust execution report is crucial for continuous improvement.
Let's imagine a scenario where the dashboard in question is designed to monitor the performance of a marketing campaign aimed at acquiring new customers for an e-commerce platform. The intended users are marketing managers and campaign analysts. The key metrics displayed on the dashboard include website traffic, conversion rates, cost per acquisition (CPA), return on ad spend (ROAS), and customer lifetime value (CLTV).

Assume the Execution Report reveals the following:
- Low User Engagement: The dashboard usage logs indicate that only 30% of the target users accessed the dashboard regularly (at least once a week). Furthermore, the average time spent on the dashboard per session was only 5 minutes.
- Inconsistent Data: Different data sources feeding into the dashboard occasionally presented conflicting information, particularly regarding attribution. This caused confusion and distrust among users.
- Lack of Actionable Insights: Users reported that while the dashboard provided a snapshot of campaign performance, it didn't offer sufficient insights to identify the root causes of problems or suggest specific actions to improve results. For example, the dashboard showed a declining conversion rate, but it didn't provide information on which marketing channels were underperforming or which segments of customers were least likely to convert.
- Delayed Data Updates: The dashboard was updated only once a day, which was insufficient for making timely adjustments to the campaign. In the fast-paced world of online marketing, a day's delay can translate into significant revenue losses.
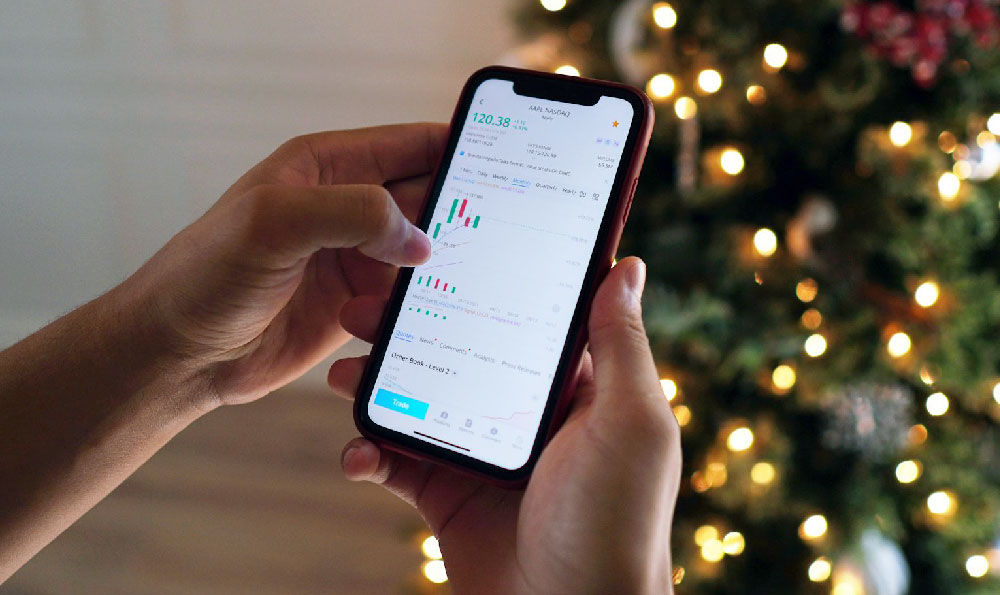
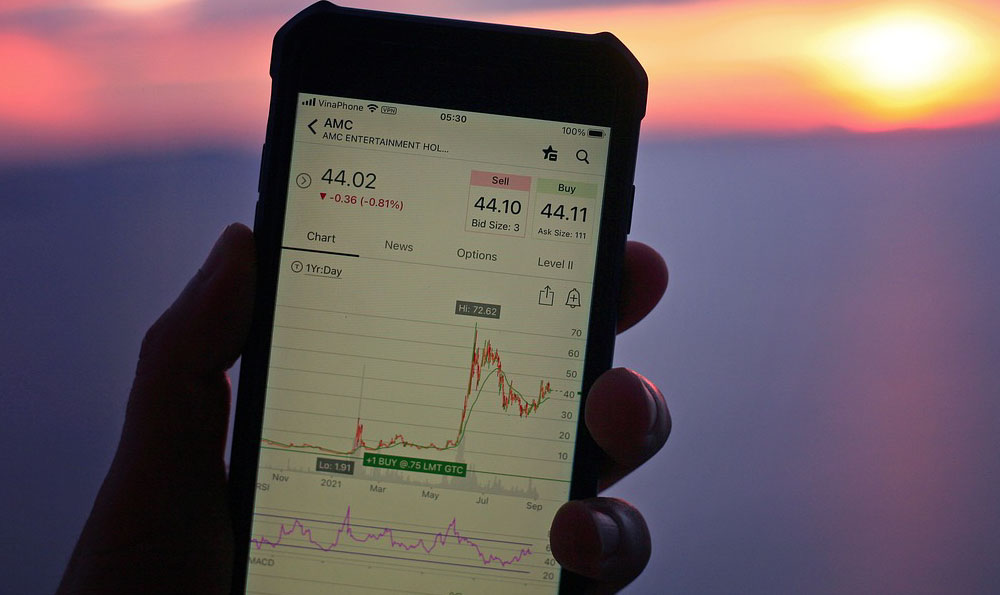
- Poor Mobile Optimization: A significant portion of the target users accessed the dashboard on mobile devices, but the dashboard was not optimized for mobile viewing. This resulted in a poor user experience and discouraged mobile usage.
So, what happened? Several factors likely contributed to these shortcomings.
Firstly, lack of user involvement in the design process might be the root cause. If the dashboard was developed without adequately considering the needs and preferences of the target users, it's unlikely to meet their expectations. This can lead to low user engagement and a perception that the dashboard is not useful. A proper user research phase involving interviews, surveys, and usability testing is necessary. This could involve creating mock-ups and prototypes of the dashboard and getting feedback from representative users before development begins.
Secondly, data quality issues can undermine the credibility of the dashboard. Inconsistent data from different sources can erode user trust and make it difficult to draw meaningful conclusions. This highlights the importance of establishing a robust data governance framework, including data validation rules, data reconciliation processes, and clear data ownership responsibilities. Data lineage should be clearly documented, showing the flow of data from its source to the dashboard, so that any discrepancies can be easily traced and resolved.
Thirdly, insufficient analytical capabilities can limit the dashboard's ability to provide actionable insights. Simply displaying aggregate metrics is not enough. The dashboard should also provide the ability to drill down into the data, segment the data, and perform comparative analysis. This requires incorporating more sophisticated analytical features, such as trend lines, scatter plots, and correlation analysis. Users should also be able to easily filter and sort the data to focus on the areas of greatest interest.
Fourthly, infrequent data updates can render the dashboard stale and irrelevant. In today's dynamic business environment, real-time or near-real-time data is often essential for making timely decisions. This requires investing in the infrastructure and processes needed to support more frequent data updates. Consider using streaming data technologies or implementing automated data pipelines to ensure that the dashboard is always up-to-date.
Fifthly, poor mobile optimization can limit the dashboard's accessibility and usability. With the increasing prevalence of mobile devices, it's essential to ensure that dashboards are designed to be responsive and work seamlessly on all screen sizes. This requires using mobile-friendly design principles, such as responsive layouts, touch-friendly controls, and optimized graphics. Consider using a mobile-first design approach, where the dashboard is designed primarily for mobile devices and then adapted for larger screens.
How can we improve?
The first step is to conduct a thorough user needs assessment. This involves interviewing users, observing how they use the dashboard, and gathering feedback on their pain points and unmet needs. This information should be used to redesign the dashboard to better meet the needs of the target users.
Next, implement a data quality management program. This involves establishing data validation rules, data reconciliation processes, and data governance policies to ensure the accuracy and consistency of the data displayed on the dashboard. Regular data audits should be conducted to identify and correct any data quality issues.
Thirdly, enhance the dashboard's analytical capabilities. This involves adding more features that allow users to drill down into the data, segment the data, and perform comparative analysis. Incorporate interactive elements, such as filters, slicers, and drill-through capabilities, to allow users to explore the data in more detail.
Fourthly, increase the frequency of data updates. This involves investing in the infrastructure and processes needed to support real-time or near-real-time data updates. Consider using automated data pipelines or streaming data technologies to ensure that the dashboard is always up-to-date.
Fifthly, optimize the dashboard for mobile devices. This involves using responsive design principles to ensure that the dashboard works seamlessly on all screen sizes. Use touch-friendly controls and optimize graphics for mobile viewing. Test the dashboard on a variety of mobile devices to ensure a consistent user experience.
Finally, establish a feedback loop. Encourage users to provide ongoing feedback on the dashboard and use this feedback to continuously improve the dashboard's functionality and usability. This could involve implementing a feedback form on the dashboard, conducting regular user surveys, or establishing a user advisory group.
By addressing these issues and implementing these improvements, we can transform the dashboard from a liability into a valuable asset that empowers users to make better decisions, drive action, and achieve better business outcomes. The Execution Report should not be a post-mortem, but a springboard for positive change. Continuous monitoring of the dashboard's usage, along with regular updates based on user feedback, will ensure that the dashboard remains relevant and effective over time.